Navigation tolerance charts
Charts are based on card sorting and tree testing.
Features
- Tolerance charts- allow scaling number of checkouts and item grouping.
- Checkouts with optimal layout- show how well elements fits in the particular checkout.
- Proximity matrix- shows proximity heatmpas as well as "proximity hubs".
- Click-thorugh chart- depending on he first click, the last click, total number of signal clicks- against the background of succesful clicks
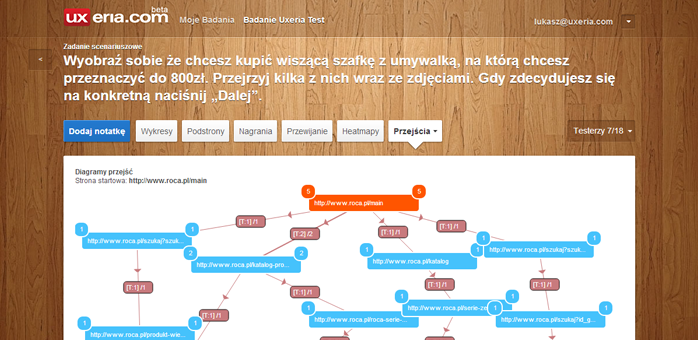
- Dendrogram menu- tolerance charts showing connections between particular elements.